Introduction
Charter schools have proliferated in Texas and across the nation. The expansion of charter schools is now a popular reform effort for many policymakers on both the right and left of the political spectrum. To examine the efficacy of such policies, a number of researchers have focused on the effects charter schools have had on student achievement, most of which have found little difference in achievement between the two types of schools (CREDO, 2009; Zimmer, R., Gill, B., Booker, K., Lavertu, S., Sass, T., and Witte, 2008). Yet, there is still a relative dearth of information about the characteristics of students entering and leaving charter schools and how these characteristics might be related to school-level achievement. This is particularly true with respect to charter schools in Texas. Most of the work in this area has focused on student racial and ethnic characteristics, while a fair number of studies have examined special education status and English-Language Learner status of entrants. Very little research has focused on the academic ability of students entering charter schools, the student attrition rate of charter schools, and the characteristics of the students staying and leaving charter schools. This study seeks to ameliorate this paucity of information, particularly as it pertains to high-profile and high-enrollment charter schools in Texas.
Findings
The findings reviewed in this section refer to the results for the most appropriate comparison—the sending schools comparison—unless otherwise noted. Full results are in the body of the report or in the appendices. The CMOs included in this particular study included: KIPP, YES Preparatory, Harmony (Cosmos), IDEA, UPLIFT, School of Science and Technology, Brooks Academy, School of Excellence, and Inspired Vision.
Characteristics of Students Entering Charter Schools
Differences in Average TAKS Z-Scores
The differences are reported in z-scores in order to make the results across school years comparable.
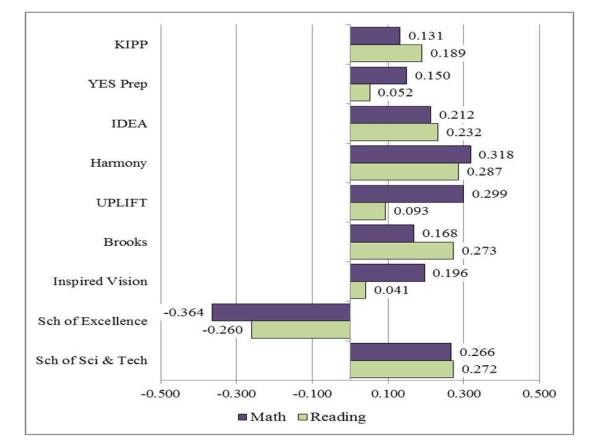
At both the 5th– and 6th-grade levels, students entering most of the CMOs in this study had TAKS mathematics and reading scores that were statistically significantly greater than comparison schools–in particular, schools that sent at least one child to the charter in question or schools located in the same zip code as the charter school.
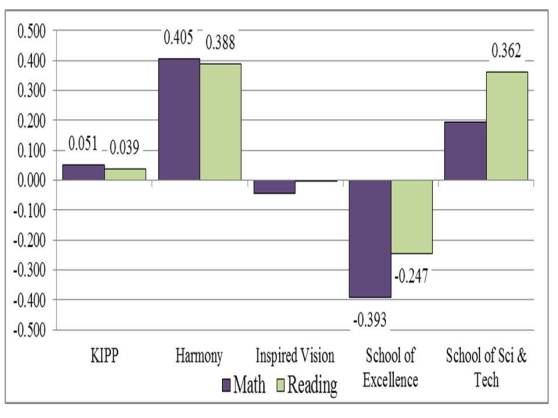
Figure 1 shows the differences for incoming 5th grade students. Note the extremely large differences for Harmony charter schools. While the differences for KIPP were small, they were still statistically significant.
Figure 1: Difference in TAKS Math and Reading Z-Scores of Students from Sending Schools Entering and Not Entering Selected CMOs
All differences denoted with a number were statistically significant at the p < .05 level
Figure 2 shows the differences for incoming 6th grade students. Most of the differences were relatively large and positive for eight of the nine CMOs, thus showing that students entering these schools have substantially greater TAKS scores than students from sending schools. Again, the differences are particularly large for Harmony schools. The results for KIPP reflect only KIPP schools with 6th grade as the entry year.
Figure 2: Difference in TAKS Math and Reading Z-Scores of Students from Sending Schools Entering and Not Entering Selected CMOs
All differences denoted with a number were statistically significant at the p < .05 level
In only a few cases was there no statistically significant difference in TAKS scores between those students entering a CMO and not entering a CMO. Only one CMO—School of Excellence—had TAKS scores that were consistently lower than comparison schools.
For CMOs with greater levels of achievement for incoming students than comparison schools, the differences tended to be both statistically significant and practically significant. In other words, the differences appeared to be large enough to potentially explain differences in the levels of achievement between the CMOs and comparison schools. This does not mean the CMOs did not have greater student growth than other schools (growth was not examined in this study), but that the differences in TAKS passing rates often cited by supporters of charter schools and politicians could potentially be explained by the initial differences in achievement levels between students entering the CMOs and comparison schools.
Distribution of TAKS Mathematics and Reading Scores
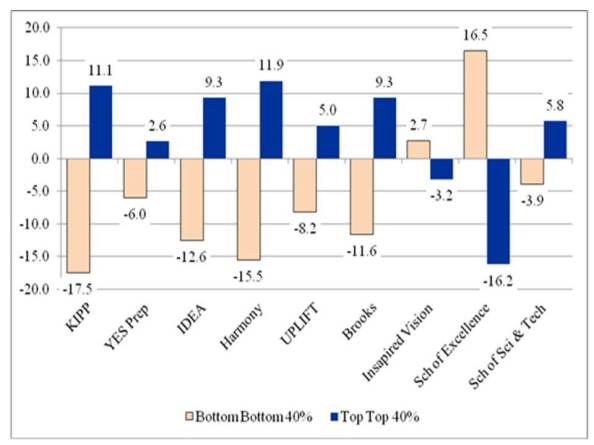
The following two figures document the distribution of TAKS mathematics and reading scores for students in CMOs and in the various comparison groups of schools. As shown in Figure 3, eight of the nine CMOs had greater percentages of students scoring in the top 40% of test-takers and lower percentages of students scoring in the bottom 40% of test-takers. The differences were greater than ten percentage points in each of the two groups for KIPP, YES Prep, Harmony, and UPLIFT. The differences for Harmony and UPLIFT approached 15 percentage points—strikingly large disparities in the performance of incoming students. The compression of reading scores against the test score ceiling could explain the smaller differences in reading than in mathematics, but further analyses are needed to examine this possibility.
Figure 3: Difference in the Percentages of 5th Grade Students Entering the 6th Grade with TAKS Mathematics Scores in the Bottom 40% of Scores and Top 40% of Scores for CMOs and Comparison Schools*
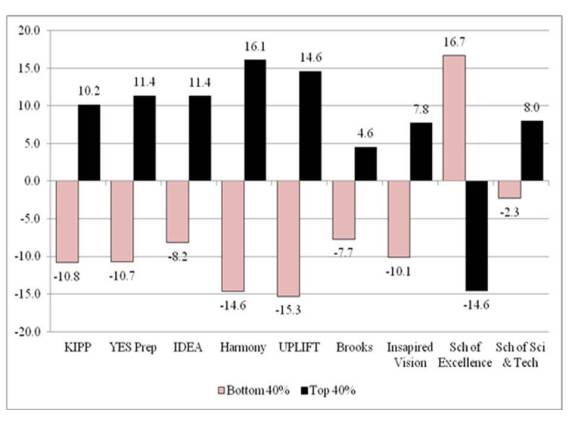 * Comparison school percentage is based on the average of the results for comparison schools in the same zip code, schools in the same zip code and contiguous zip codes, and sender schools
Figure 4: Difference in the Percentages of 5th Grade Students Entering the 6th Grade with TAKS Reading Scores in the Bottom 40% of Scores and Top 40% of Scores for CMOs and Comparison Schools*
* Comparison school percentage is based on the average of the results for comparison schools in the same zip code, schools in the same zip code and contiguous zip codes, and sender schools
Differences in Scores for All Students and Economically Disadvantaged Students (Students Entering the 5th Grade)
This section examines the TAKS math and reading scores of 4th grade students identified as economically disadvantaged entering CMOs in the 5th grade. Students entering a CMO were defined as not having been enrolled in the same CMO in the previous year. Further, a student must have been identified as economically disadvantaged to be included in the analysis. Finally, the analysis focuses only on those students enrolled in the 4th grade in a “sending” school—a school that sent at least one student to that particular CMO in at least one of the cohorts of students included in the analysis. Statistically significant differences are noted by inclusion of the difference in z-scores in the graph. If the difference between students entering the CMO and not entering the CMO was not statistically significantly different, then no number was included in the graph.
TAKS Mathematics
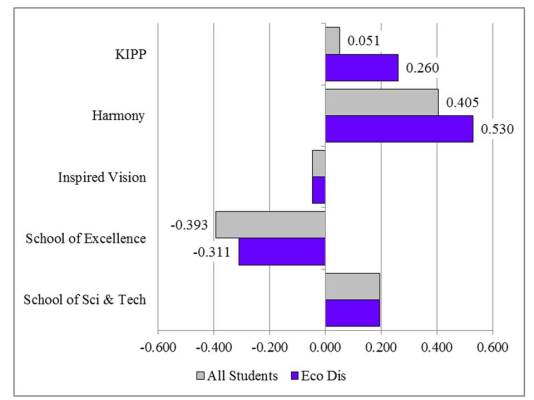
As shown in Figure 5, both all students and economically disadvantaged students entering KIPP and Harmony had greater TAKS math z-scores than all students and economically disadvantaged students from sending schools that did not enter the CMOs. Moreover, the differences for economically disadvantaged students were greater than for all students. For economically disadvantaged students entering KIPP, the difference was 0.260 standard deviations while the difference for students entering Harmony was 0.530. Both differences were quite substantial. Thus, economically disadvantaged students entering KIPP and Harmony has substantially greater prior mathematics scores than students from sending schools that did not enter KIPP or Harmony.
Both all students and economically disadvantaged students entering the School of Excellence, on the other hand, had prior math scores that were lower than the prior math scores for students not entering the School of Excellence. The difference was smaller for economically disadvantaged students than for all students.
Figure 5: Differences in TAKS Mathematics Z-Scores Between Economically Disadvantaged Students Entering and Not Entering Selected CMOs for All Texas Students and Sending School Comparison Groups (4th Grade Scores of Incoming 5th Grade Students)
All differences denoted with a number were statistically significant at the p < .05 level
TAKS Reading
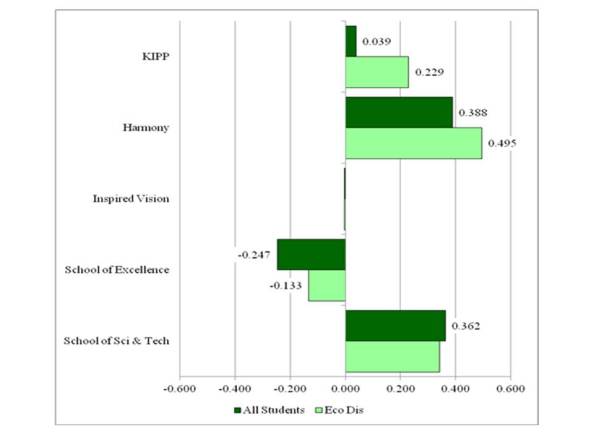
As shown in Figure 6, the results for reading were quite similar to the results for mathematics. For example, all students and economically disadvantaged students entering KIPP and Harmony had greater TAKS reading scores than students from sending schools not entering those CMOs. Further, the differences were much greater for economically disadvantaged students than for all students. For economically disadvantaged students entering KIPP, the difference was 0.229 while the difference for economically disadvantaged students entering Harmony was 0.495. Again, as with the differences in mathematics, the differences in reading were quite substantial for these two CMOs. Thus, economically disadvantaged students entering KIPP and Harmony were far higher performing than economically disadvantaged students from the very same schools that did not enter these CMOs.
Figure 6: Differences in TAKS Reading Z-Scores Between Economically Disadvantaged Students Entering and Not Entering Selected CMOs for All Texas Students and Sending School Comparison Groups (5th Grade Scores of Incoming 6th Grade Students)
All differences denoted with a number were statistically significant at the p < .05 level
Differences in Scores for All Students and Economically Disadvantaged Students (Students Entering the 5th Grade)
TAKS Mathematics
As shown in Figure 7, the differences in TAKS mathematics scores for economically disadvantaged students were statistically significant and positive for eight of the nine CMOs (School of Excellence was excluded from the graph, but had a statistically significant difference that indicated economically disadvantaged students entering the CMO had lower TAKS mathematics scores than students from sending schools not entering the CMO). All but one of the eight differences was at least 0.200 standard deviations and three of the differences were greater than 0.300 standard deviations. Further, and perhaps more importantly, the differences were substantially larger than the differences for all students for the eight selected CMOs except Inspired Vision. Thus, undoubtedly, the economically disadvantaged students entering the CMOs were substantially different than the students from the very same schools that did not enter the CMOs. Indeed, the economically disadvantaged students entering the CMOs had far greater levels of achievement than the economically disadvantaged students that did not enter the CMOs.
Figure 7: Differences in TAKS Mathematics Z-Scores Between Economically Disadvantaged Students Entering and Not Entering Selected CMOs for All Texas Students and Sending School Comparison Groups
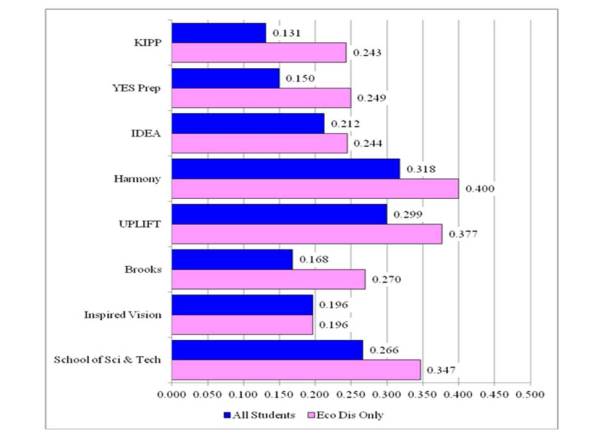 All differences denoted with a number were statistically significant at the p < .05 level
TAKS Reading
As shown in Figure 8, eight of the nine CMOs had statistically significant differences in TAKS reading scores for economically disadvantaged students that revealed students entering the CMOs had greater TAKS reading scores than students from the sending schools not entering the CMOs (again, School of Excellence was excluded from the graph, but had a statistically significant, negative, and larger difference for economically disadvantaged students). All but one of the differences was greater than 0.150 standard deviations and four of the differences were greater than 0.350 standard deviations. As with the mathematics finding, this clearly demonstrates that economically disadvantaged students entering the CMOs had far greater levels of reading achievement than students from sending schools that did not enter the CMOs.
Figure 8: Differences in TAKS Reading Z-Scores Between Economically Disadvantaged Students Entering and Not Entering Selected CMOs for All Texas Students and Sending School Comparison Groups
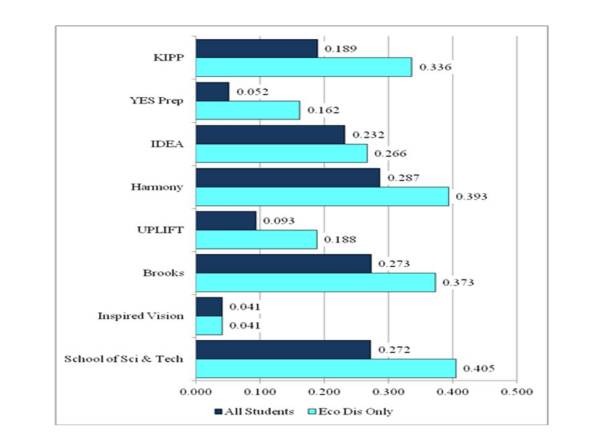 All differences denoted with a number were statistically significant at the p < .05 level
Difference in Economically Disadvantaged Students
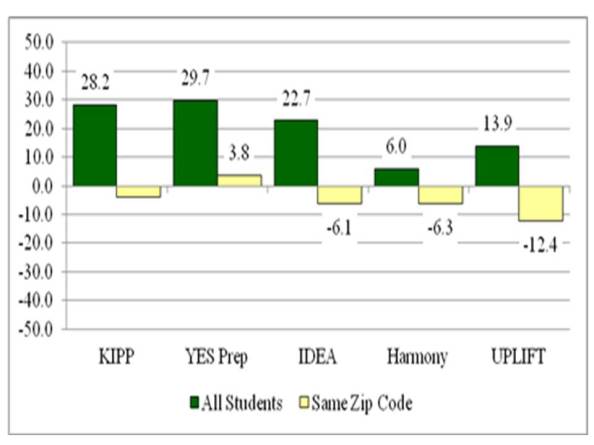
Figure 9 shows the results for the statewide comparison and the comparison between a CMO and other schools in the same zip code. KIPP, IDEA, Harmony, and UPLIFT all had a greater percentage of students entering the schools identified as economically disadvantaged as compared to all students in the state. Alternatively, when compared to schools located in the same zip codes as the CMOs, a lower percentage of students identified as economically disadvantaged entered the CMOs. Again, this shows that the comparison set of schools or students employed in an analysis can substantially alter the results. Indeed, in this case, comparing the percentage of economically disadvantaged students in the CMO to all students in the state suggests that the CMOs enroll a greater percentage of economically disadvantaged students. When the comparison group employed is students enrolled in schools within the same zip code as the CMO, however, an entirely different picture emerges. Indeed, now a lower percentage of students entering the CMOs were designated as economically disadvantaged.
Figure 9: Differences in the Percentage of Economically Disadvantaged Students Entering the 6th Grade between Students Entering Selected CMOs and not Entering CMOs From All Schools and Schools in the Same Zip Code
All differences denoted with a number were statistically significant at the p < .05 level
STUDENT RETENTION RATES
This section examines student retention and attrition from a few different perspectives. All of the analyses focus on students enrolled in schools in the 6th grade in either the 2007-08 or 2008-09 school years. Further, the two cohorts were combined into one group of students included in the analyses. These two years were selected because they were the two most recent years for which data was available to track retention from 6th grade through two years later—presumably 8th grade for most students. Prior years would have been included, but too few charter schools enrolled students in grades six through eight in prior years to yield sample sizes ;large enough for reliable estimates. This underscores the fact that even though charter schools have existed since 1997, very few have graduated complete cohorts of students over more than a few years.
School and District Retention Rates
In this study, student retention refers to students remaining enrolled in the same school rather than students being retained in the same grade. In the analyses below, student retention rates indicate the percentage of students remaining enrolled in the same school from 6th grade through 6th, 7th, or 8thgrade two years later. All students enrolled in the 6th grade—regardless of previous enrollment in the particular CMO, were included in the analyses.
Because this analysis examined two-year retention rates, only students enrolled in schools that had grades six, seven, and eight for at least two consecutive cohorts of students were included in the analysis So, for example, if a student was enrolled in the 6th grade in 2008, then the school had to enroll at least 10 students in the 6th grade in 2008, 10 students enrolled in the 7th grade in 2009, and 10 students enrolled in the 8th grade in 2010 to be included in the analysis.
Because so few charter schools met this criteria prior to 2008, only the last two cohorts of 6th-grade to 8th-grade of students were included in the analysis. Even focusing on just the last two cohorts removed a large number of charter schools because most charter schools simply have not been in existence for enough years to meet the criteria set forth.
In addition, because some districts opened new schools and, consequently, large numbers of students moved from one middle school to another, schools with low school retention rates and high intra-district mobility rates were not included in the analysis. In general, any school with a district mobility rate of greater than 20% was excluded from the analysis. Ultimately, the inclusion or exclusion of such schools resulted in only a marginal difference in retention rates for comparison schools.
The results for KIPP were complicated by the 6th grade not being the lowest grade level in most KIPP middle schools. For three of the seven KIPP middle schools, the initial grade level was the 5th grade, not the 6th grade. These schools had already experienced initial attrition.
Finally, the comparison set of schools employed in this particular analysis was all schools located in the same zip code as the charter school or in a zip code contiguous to the zip code in which the charter school was located.
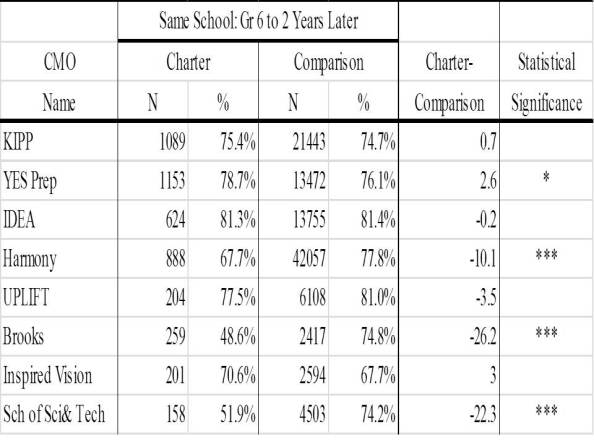
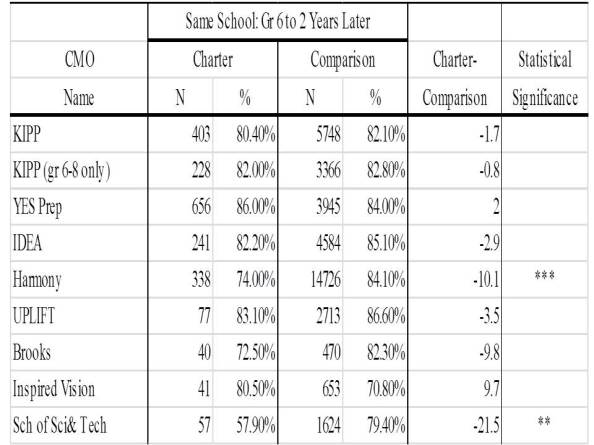
As shown in Table 1, three of the eight CMOs had a statistically significant lower two-year school retention rates than their comparison schools while one had statistically significantly greater two-year retention rate. The three with statistically significant differences (Harmony, Brooks, and School of Science and Technology), all had retention rates lower than the retention rates for traditional public schools. Harmony had a retention rate almost 20 percentage points lower than comparison schools while both Brooks and School of Science and Technology had retention rates 24and 27 percentage points lower than comparison schools respectively. Strikingly, Harmony lost more than 40% of 6th grade students over a two-year time span while Brooks and School of Science and Technology lost about one-half of all 6th grade students in a two-year time span. YES Prep had a slightly greater retention rate than comparison schools. The difference was slight at 2.6 percentage points. This difference disappeared when student transfers within the YES Prep CMO were not considered as students staying enrolled at the same school.
Finally, when only traditionally configured middle schools were included in the KIPP analysis, the four schools serving grades 6 through 8 had a retention rate of 74.7%. This was only slightly lower than the overall retention rate and was still not statistically significantly different than the comparison set of schools for the four KIPP middle schools.
Table 1: School Retention Rates (6th Grade to Two Years After 6th Grade)
^ p < .10; * Pp < .05; ** p < .01; *** p < .001
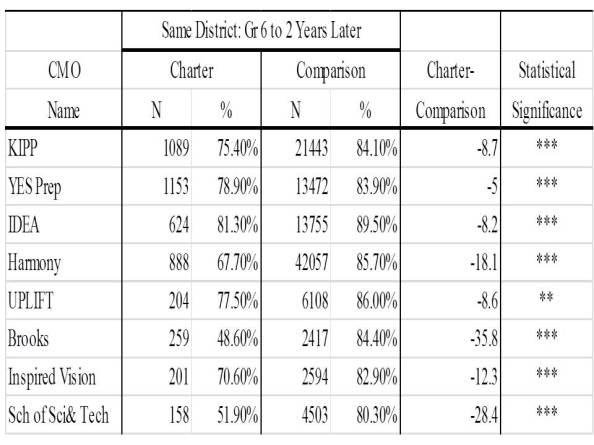
Table 2 includes the district-level two-year retention rates. In this analysis, a student staying within the same school district or same CMO was defined as being retained in the district. Note that these rates were identical to the school retention rates for CMOs because of the manner in which I coded the data. The traditional public comparison schools all had statistically significantly greater district retention rates than the CMOs. All of the differences were at least five percentage points, with the greatest differences reserved for Brooks Academy (35.8), School of Science and Technology (28.4), and Harmony (18.1).
Table2: Student District Retention Rates (6th Grade to Two Years After 6th Grade)
^ p < .10; * Pp < .05; ** p < .01; *** p < .001
Stayers and Leavers by Test Scores
While overall retention rates provide important outcome information as well as information that might affect school-level achievement, the characteristics of the students that stay or leave a school also provides critical information that may influence judgments about the academic efficacy of a particular school. For example, in examining the achievement of two schools that have the same retention rate, a school that loses lower performing students to a greater degree than higher performing students may artificially inflate overall performance levels as well as create a peer group effect that improves changes in improvement.
The following four tables include the school retention rates for students in CMOs and in traditional public schools in the same geographic location. Some schools were excluded such as schools that had high attrition rates due to intra-district student migration patterns caused by school feeder pattern or boundary changes. This was based on a comparison of school retention rates and within-district migration over a three-year period. In general, schools that had at least 20% student migration to other schools within the district were excluded from the analysis. Further, schools without a regular accountability rating were excluded from the analysis since such schools typically serve students with disciplinary issues or that have special needs. Finally, charter schools were excluded from the comparison group, thus leaving only traditional public schools in the comparison group. The analysis was first conducted without excluding charter schools and retention rates were somewhat lower. Careful examination of the data indicated that Harmony and a few special setting charter schools had very low retention rates that were lowering the average of the comparison groups in the setting, albeit by only a few percentage points.
Note that not all students had TAKS scores. Thus, the rates and data in these tables are not directly comparable to tables with the overall attrition rate.
TAKS Mathematics Scores
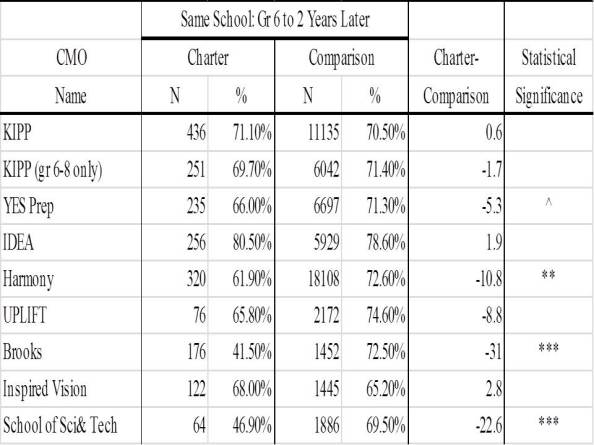
Table 3 compares the retention rates between CMOs and traditional public comparison schools for lower performing students on the 6th grade mathematics examination. Students with z-scores less than -0.25 were designated as lower performing.
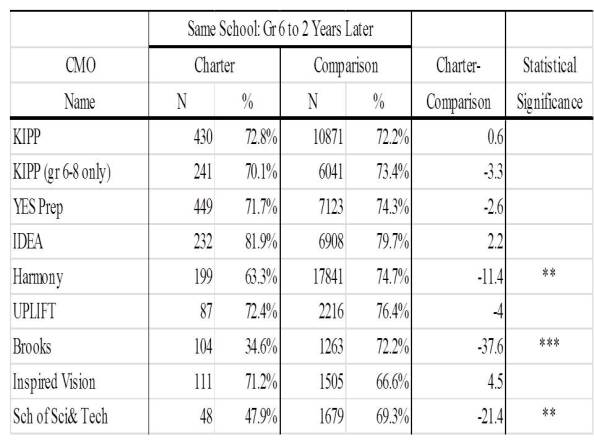
Four CMOs had statistically significantly lower retention rates for lower performing students: YES Prep, Harmony, Brooks Academy, and School of Science and Technology. The differences for YES Prep and Harmony were moderately large at 5 and almost 11 percentage points, respectively. The differences for School of Science and Technology and Brooks Academy were very large at almost 23 and 31 percentage points respectively. Note that there was no statistically significant difference in retention rates for all students for YES Prep, but a statistically significant difference for lower performing students.
Table 3: Student Retention Rates for Lower Performing Students on the 6th Grade TAKS Mathematics Test for CMOs and Comparison Traditional Public Schools
^ p < .10; * Pp < .05; ** p < .01; *** p < .001
Table 4 compares the retention rates between CMOs and traditional public comparison schools for higher performing students on the 6th grade mathematics examination. Students with z-scores greater than 0.25 were designated as lower performing. Four CMOs had statistically significantly lower retention rates for lower performing students: YES Prep, Harmony, Brooks Academy, and School of Science and Technology. The differences for YES Prep and Harmony were moderately large at 6 and almost 11 percentage points, respectively. The differences for School of Science and Technology and Brooks Academy were very large at almost 23 and 31 percentage points respectively. Note that there was a statistically significant difference in retention rates for lower performing students for YES Prep, but not a statistically significant difference for higher performing students. Closer inspection also reveals that YES Prep and Brooks Academy were the only CMOs to have lower retention rates for lower performing students and higher retention rates for higher performing students.
Table 4: Student Retention Rates for Higher Performing Students on the 6th Grade TAKS Mathematics Test for CMOs and Comparison Traditional Public Schools
^ p < .10; * Pp < .05; ** p < .01; *** p < .001
TAKS Reading Scores
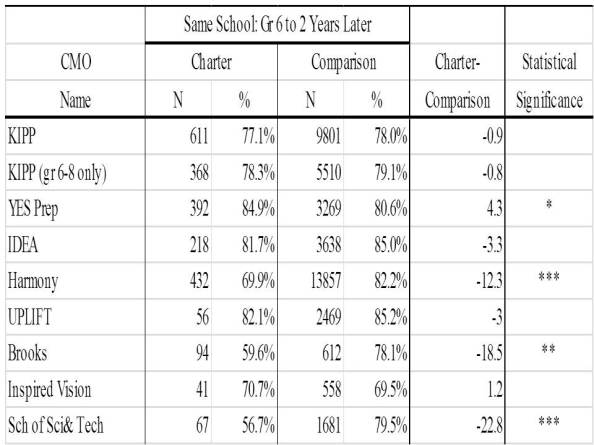
Table 6 compares the retention rates between CMOs and traditional public comparison schools for lower performing students on the 6th grade reading examination. Students with z-scores less than -0.25 were designated as lower performing. The same three CMOs with lower retention rates for lower performing students in mathematics also had statistically significantly lower retention rates for lower performing students in reading: Harmony, Brooks Academy, and School of Science and Technology.
Table 6: Student Retention Rates for Lower Performing Students on the 6th Grade TAKS Reading Test for CMOs and Comparison Traditional Public Schools
^ p < .10; * Pp < .05; ** p < .01; *** p < .001
Table 7 compares the retention rates between CMOs and traditional public comparison schools for lower performing students on the 6th grade reading examination. Students with z-scores less than -0.25 were designated as lower performing.
The same three CMOs with lower retention rates for lower performing students also had lower retention rates for higher performing students. Note, however, that the difference between Brooks Academy and comparison schools was greater for lower performing students than for higher performing students, thus suggesting some selective attrition that may impact the distribution of test scores.
There was also a statistically significant difference for YES Prep. Higher performing students on the reading test were more likely to remain at YES Prep than for comparison schools. This, coupled with the lower retention rates for lower performing students also suggests some selective attrition that may have impacted the distribution of student test scores for YES Prep.
Table 7: Student Retention Rates for Higher Performing Students on the 6th Grade TAKS Reading Test for CMOs and Comparison Traditional Public Schools
^ p < .10; * Pp < .05; ** p < .01; *** p < .001
Effects of Attrition on the Distribution of TAKS Scores
If student attrition differs across students with various levels of student achievement, then student attrition may positively or negatively impact overall school student test scores. For example, if student attrition tends to be greater for lower performing than for higher performing students, the overall test score profile of a school could improve regardless of whether the remaining students had improved test scores. Alternatively, if attrition affects higher performing students to a greater degree than lower-performing students, then a school’s test score profile could appear lower than it might have been otherwise if the higher performing students had not left the school.
Further, research suggests that peer effects have relatively powerful effects on student achievement. For example, all other factors being equal, an average performing student placed with a group of higher performing students will typically have greater gains in achievement than if placed with a group of lower performing students (need references).
Thus, the intent of this section was to examine the effect attrition may have on the composition of students with respect to test scores. This analysis focused only on those students enrolled in a school in the 6th grade and then enrolled in the 8th grade two years later in the same school. The TAKS score ranges were based on the 6th grade score of the student and the percentages in the table represent the distribution of students by the 6th grade TAKS scores for all students enrolled in the 6th grade and the students remaining in the school in the 8th grade.
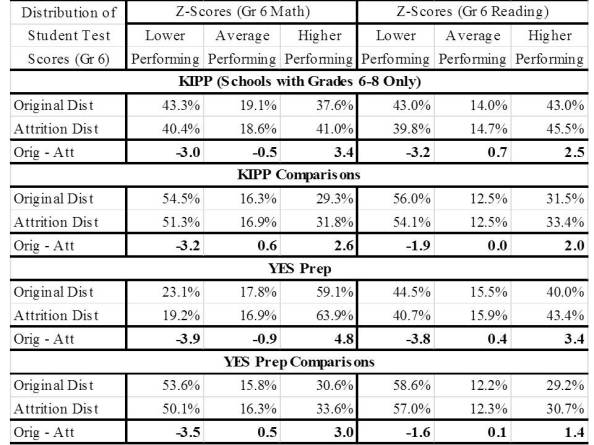
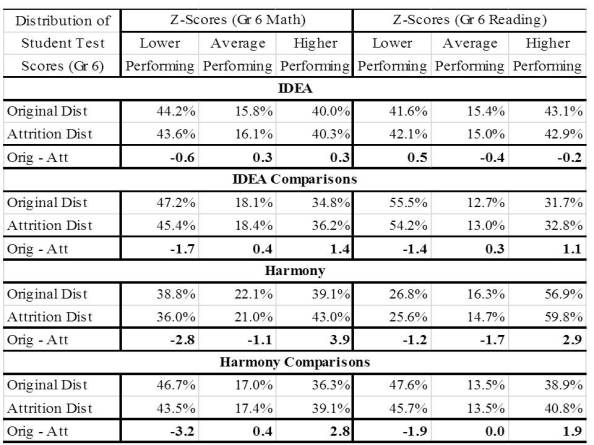
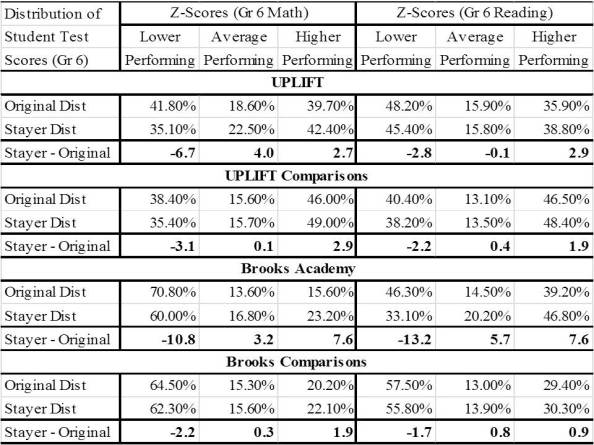
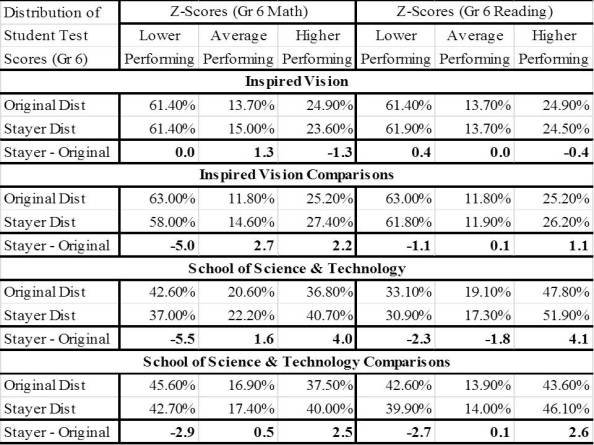
Tables 8a, 8b, 8c, and 8d detail the distribution of TAKS mathematics and reading z-scores in the 6th grade for all students enrolled in the 6th grade in the 2007-08 and 2008-09 and the distribution of the z-scores for students remaining in the same school from 2007-08 through 2009-10 and from 2008-09 through 2010-11. The row labeled “Original Dist” includes the distribution of scores for all students enrolled in the 6th grade and the row labeled “Stayer Dist” displays the z-score distribution of 6th grade scores for only those students that remained at the school for two years after the 6th grade. The third row, labeled “Stayer – Original” is the difference in the percentage of students in a particular category of z-scores between students staying at the school and the for all students originally enrolled. In this way, the data in the table document the changes in the distribution of 6th grade scores due to the removal of students leaving the school.
Before examining the impact of attrition on the distribution of scores, Tables 20a and 20b also detail the vast differences in the initial distribution of scores between CMOs and comparison schools. For all but UPLIFT and Inspired Vision, the CMOs had students that had distribution of scores that were much more favorable than for the comparison schools. For example, nearly 60% of the YES Prep 6th grade students were higher performing in mathematics as compared to only about 31% for comparison schools. In some cases, these rather substantial differences simply expanded due to attrition as will be described below.
As shown in Table 8a and 8b, KIPP, YES Prep, and Harmony and their comparison schools all evidenced a similar pattern in which the percentage of lower performing students (those with z-scores lower than -0.25) decreased and the percentage of higher performing students (those with z-scores greater than 0.25) increased. While the overall trend was the same for all three CMOs, there were, however, some apparent differences in the re-distribution of scores between the CMOs and comparison schools.
In mathematics, KIPP schools had a greater decrease in the percentage of lower- and average-performing students than comparison schools and a greater increase in the percentage of higher-performing students. The difference in the percentage of higher performing students, however,, was less than one percentage point. In reading, both KIPP and comparison schools had a decrease in the percentage of lower performing students, but the decrease was more than one percentage point greater for KIPP than comparison schools. KIPP also evidenced an increase of almost one percentage point in the percentage of average performing students while comparison schools had no increase. Finally, the increase in the percentage of higher performing students was 0.5 percentage points greater for KIPP than for comparison schools. Thus, the findings suggest a slightly greater re-distribution of scores upward for KIPP than for comparison schools.
Alternatively, the differences between YES Prep and Harmony and the comparison schools was greater than the differences for KIPP and their comparison schools and the differences suggest an important re-distributional effect from attrition of students from YES Prep and Harmony.
For YES Prep in mathematics, there was almost a five percentage point decrease in the lower- and average- performing students and almost a five percentage point increase in the percentage of higher performing students. Comparison schools had a 3.5 percentage point decrease in the percentage of lower performing students and a 0.5 percentage point increase in the percentage of average performing students and only a three percentage point increase in the percentage of higher performing students. Thus, the initial differences in performance at the 6th grade starting point between YES Prep and comparison schools simply grew larger due to the differences in attrition between YES Prep and comparison schools. Thus, even if students made no progress on the TAKS tests, YES Prep would have appeared to have made greater progress due to differences in attrition across the distribution of scores.
With respect to Harmony schools, there was a decrease in both the percentage of lower- and average-performing students and a commensurate increase in the percentage of higher-performing students. This was ore pronounced for mathematics than for reading. For comparison schools, there was a decrease in lower performing students in both subject areas, but no real change in the percentage of average performing students. Ultimately, the increase in the percentage of higher performing students in comparison schools was lower than the increase for Harmony schools. The differences, however, were only one percentage point. Thus, Harmony have benefited more from the re-distribution of scores due to attrition more than comparison schools, but the advantage would have been less than the advantage for YES Prep.
Interestingly, there was no significant re-distribution of scores due to attrition for IDEA schools in either subject. For IDEA comparison schools, there was a slight upward re-distribution of scores. Thus, in this particular case, the comparison schools garnered a greater positive re-distributional effect from attrition than IDEA schools.
Table 8a: Distribution of Students TAKS Mathematics and Reading Z-Score Ranges for Students Enrolled in the 6th Grade and Students Remaining in the Same School (KIPP and YES Prep)
Table 8b: Distribution of Students TAKS Mathematics and Reading Z-Score Ranges for Students Enrolled in the 6th Grade and Students Remaining in the Same School (IDEA and Harmony)
The remaining four CMOs and comparison schools are included in Table 8c and 8d. The re-distributional effects were greater for these four CMOs than for the first four CMOs. The smaller sample sizes and greater attrition rates are two reasons for these greater shifts in scores after attrition of students.
In both subject areas, UPLIFT experienced a greater upward re-distribution of scores than for comparison schools, although the effect in reading was relatively small. The impact on mathematics scores, however, was substantial. Indeed, There was a 6.7 percentage point decrease in the percentage of lower performing students in UPLIFT and a 4.0 percentage point increase for average performing students and a 2.7 percentage point increase for higher performing students. This re-distributional shift was far more positive than for comparison schools.
For Brooks—which had an extremely high overall attrition rate—there was a massive re-distribution of scores after the attrition of students. Specifically, in both subjects areas, there was greater than a 10 percentage point decrease in the percentage of lower performing students and an almost 8 percentage point increase in the percentage of higher performing students. For comparison schools, there was a small decrease in the percentage of lower performing students and a small increase in the percentage of higher performing students, but the changes were quite small in relation to the large changes for Brooks. Thus, Brooks Academy test scores improved rather dramatically for the two cohorts of students simply by losing large percentages of lower performing students.
In mathematics, both Inspired Vision and comparison schools lost a substantial proportion of lower performing students (5 percentage points). The scores for Inspired Vision shifted into the average- and higher-performing categories while most of the increase was for the higher performing categories for the comparison schools. For reading, there was a similar result. For comparison schools, there was a decrease of around two percentage points for both lower- and average performing students and increase of four percentage points for higher performing students. This was much greater than the one percentage point increase for Inspired Vision. Thus, Inspired Vision comparisons schools benefited more from attrition than did Inspired Vision.
Finally, the School of Science and Technology had a greater upward re-distribution of scores due to attrition than for comparison schools. For both mathematics and reading, the increase in the percentage of higher-performing students was about 1.5 percentage points. In mathematics, the School of Science and Technology also had a far greater decrease in the percentage of lower-performing students: 5.5 percentage points to 2.9 percentage points for comparison schools.
Table 8c: Distribution of Students TAKS Mathematics and Reading Z-Score Ranges for Students Enrolled in the 6th Grade and Students Remaining in the Same School (UPLIFT and Brooks Academy)
Table 8d: Distribution of Students TAKS Mathematics and Reading Z-Score Ranges for Students Enrolled in the 6th Grade and Students Remaining in the Same School (Inspired Vision and Scool of Science and Technology)
While these shifts may appear relatively small, in many cases the re-distribution of scores simply exacerbated existing differences in the distribution of scores between CMOs and comparison schools as shown in previous sections. Further, the differences are compounded because they occur for every cohort of students in the school. The most pronounced effects of attrition may be to reinforce certain peer group effects. If students see that peers that “cannot cut it” systematically leave a school, then the remaining students may be more motivated to work even harder to ensure continued enrollment in their school of choice.
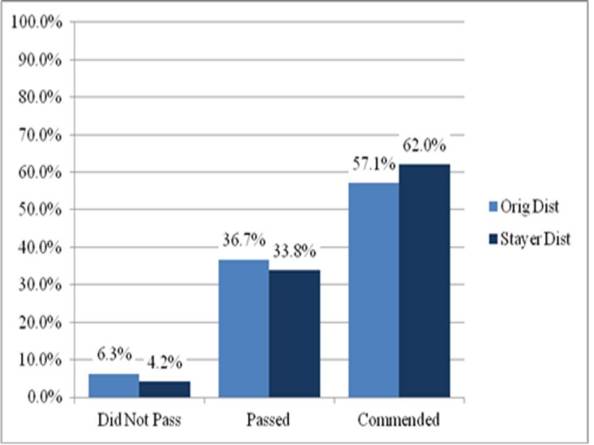
How does this affect the performance levels reported by the state such as the percentage of students passing and percentage of students achieving commended status? The effects turn out to be quite similar. Figure 10 below shows that student attrition increased the percentage of students that had passed or met commended status on the 6th grade mathematics test for YES Prep. In fact, the increase in the percentage of students that had met commended status increased from 57.1% to 62.0%. Again, this suggests a re-distribution of students after attrition such that lower-performing students were more likely to leave the school and higher-performing students were more likely to stay at the school.
Figure 10: Change in the Percentage of Students Passing and Meeting Commended Status on the TAKS Mathematics Test after Student Attrition for YES Prep Middle Schools
While these analyses do not reveal how student attrition impacts the actual scores, passing rates, and commended rates on the 8th grade test, the fact that students passing or meeting the commended standard typically continue to meet those standards on future tests, the results do strongly suggest that attrition artificially increases passing and commended rates for some CMOs such as YES Prep.
FINAL CONCLUSIONS AND DISCUSSION
This study is a preliminary examination of high-profile/high-performing charter management organizations in Texas. Specifically, the study examined the characteristics of students entering the schools, retention/attrition rates; and,the impact of attrition/retention rates on the distribution of students.
Contrary to the profile often portrayed in the media, by some policymakers, and by some charter school proponents (including some charter CEOs), the high-profile/high-enrollment CMOs in Texas enrolled groups of students that would arguably be easier to teach and would be more likely to exhibit high levels of achievement and greater growth on state achievement tests. Indeed, the above analyses showed that, relative to comparison schools, CMOs had:
- Entering students with greater prior TAKS scores in both mathematics and reading;
- Entering economically disadvantaged students with substantially greater prior TAKS scores in both mathematics and reading;
- Lower percentages of incoming students designated as ELL;
- Lower percentages of incoming students identified as special needs; and,
- Only slightly greater percentages of incoming students identified as economically disadvantaged.
In other words, rather than serving more disadvantaged students, the findings of this study suggest that the high-profile/high-enrollment CMOs actually served a more advantaged clientele relative to comparison schools—especially as compared to schools in the same zip code as the CMO schools. This is often referred to as the “skimming” of more advantaged students from other schools. While CMOs may not intentionally skim, the skimming of students may simply be an artifact of the policies and procedures surrounding entrance into these CMOs.
Thus, the comparisons that have been made between these CMOs and traditional public schools—especially traditional public schools in the same neighborhoods as the CMO schools—have been “apples-to-oranges” comparisons rather than “apples-to-apples” comparisons. The public and policymakers need to look past the percentages of economically disadvantaged students and disabuse themselves of the notion that enrolling a high percentage of economically disadvantaged students is the same as having a large percentage of lower-performing students. In fact, despite a large majority of students entering the CMOs identified as economically disadvantaged, students at the selected CMOs tended to have average or above average TAKS achievement and certainly greater achievement levels than comparison schools. This was particularly true when comparing economically disadvantaged students in CMOs and traditional public schools—the economically disadvantaged students in CMOs had substantially greater academic performance than the economically disadvantaged students in the comparison traditional public schools.
There were few differences in attrition rates between CMO and comparison schools (with Harmony, Brooks Academy, and School of Science and Technology being the exceptions) and the attrition rates did not appear to advantage or disadvantage CMOs as a group relative to comparison schools. Three CMOs did appear to have selective attrition such that scores were artificially increased by the loss of lower performing students and the retention of higher performing students. These three CMOs were Brooks Academy, UPLIFT, and YES Prep.
What is beyond the scope of this study is to determine the effect of “skimming” higher performing students from traditional public schools, the effect of selective attrition, and the effect of selective “back-filling” might have on student peer effects. If, in fact, academic achievement gains are driven by the impacts of these phenomena on peer effects, then policymakers would need to ask whether CMOs are assisting truly disadvantaged students or simply serving as voluntary magnet schools that have selective entrance and attrition.
Ultimately, while far more detailed and sophisticated research needs to occur in this area, these preliminary results should raise serious questions about how the characteristics of incoming students and the effect of attrition might impact the achievement profiles of CMOs and other schools. These questions beg to be answered before state policymakers endeavor to further expand and provide greater support to such CMOs and local policymakers move to replicate charters or adopt charters to replace local schools.
++++++++++++++++++++++++++++++++++++++++++++++++++++++++++++++++++++++++++++++++++++++++++
This study was commissioned by the Texas Business and Education Coalition. TBEC was formed by Texas business leaders to engage with educators in a long-term effort to improve public education in Texas. Since its formation in 1989, TBEC has become one of the state’s most consistent and important forces for improving education in the state. Conclusions are those of the author and do not necessarily reflect the views of TBEC, its members or sponsors.
DATA AND METHODOLOGY
This section provides a description of the data and methodology employed in this study.
Data
This study relied on three sources of data. The first source was student-level testing data from the Texas Education Agency (TEA). The data was purchased from TEA by TBEC for the purpose of examining important education topics in Texas. The second set of data was school-level information from the Academic Excellence Indicator System (AEIS).The third set of data was the Financial Allocation Study for Texas from the Texas State Comptroller’s Office.
Student-Level Testing Data
The testing data included information on students taking the Texas Assessment of Knowledge and Skills (TAKS) from spring 2003 through summer 2011 in grades three through 12. Student information includes the school and district in which the student was enrolled when s/he took the TAKS test, grade level, economically disadvantaged status, test score, score indicator, exemption status (e.g., special education exemption, Limited English Proficiency exemption, absent, etc.) and test type. Importantly, even if a student did not actually take the TAKS, such a student would be included in the data because an answer document was submitted for the student. Because of FERPA, some information was masked by TEA. However, the student was not removed from the data and the student was still associated with a particular school and district.
School-Level AEIS data
The school-level AEIS data included a wealth of information on schools in Texas, including charter status, district in which the school was located, the region of the state in which the school was located, the overall number of students, and the number and percentage of students with various characteristics (i.e., percentage of economically disadvantaged students, percentage of White students, percentage of Latino students, percentage of African American students, etc.) and participating in specific education programs (special education, bilingual education, English as a Second Language).
Student Characteristics Included the Analyses
The characteristics examined in this section include:
- TAKS mathematics scores;
- TAKS reading scores;
- Economically disadvantaged status;
- Spanish-Language TAKS test;
- Exemption from TAKS for Limited English Proficiency (LEP) reasons; and
- Special Needs students as identified by the type of TAKS tests taken by the student.
TAKS Scores
Because metrics such as passing TAKS, achieving commended status on TAKS, and scale scores on TAKS vary over time, with students in later cohorts being more likely to have passed, attained commended status, or achieved a higher scale score than students in earlier cohorts, such metrics would not provide an appropriate measure to use across multiple cohorts of students. In order to compare achievement levels in a defensible manner, the TAKS scale scores were standardized across years and test administrations so schools with more students in later cohorts and fewer in earlier cohorts would not have artificially greater scores and schools with more students in earlier cohorts would not have artificially lower scores. To standardize the TAKS scores over time, the scale scores were converted to z-scores for each grade level and year. Further, z scores were calculated separately for students taking different versions of the test. Thus, a separate z-score was calculated for all students taking the standard TAKS, TAKS-modified, and TAKS-alternative versions of the test for each grade level and each subject area.
Economically Disadvantaged Status
In Texas, economically disadvantaged is determined by participation in the federal free-/reduced-price lunch program. In addition, a student can be identified as economically disadvantaged if she or he is eligible for other public assistance programs intended for families in poverty. In the data provided by TEA, the district in which the student enrolled identified whether or not a student was classified as economically disadvantaged.
English Language Learner Status
English Language Learner (ELL) students were identified in two ways. First, students were identified by having taking the Spanish-language version of the TAKS. The Spanish version was available in grades three through six. Second, the test score code provided by the state also identified those students exempted from testing for Limited English Proficiency (LEP) reasons. Thus, measures four and five were collapsed into one measure identifying students as English-Language Learner students. While there was some overlap between the two groups, only 7% of the students taking the Spanish TAKS were also identified as being LEP exempt. Ultimately, a student was identified as ELL if the student (a) took the Spanish-language TAKS in the previous year or (b) was exempted from TAKS testing because of LEP reasons.
Special Needs Students
Special needs students were identified by the type of TAKS test taken by the student. Unfortunately, this data was only available in academic years 2008 through 2010. In previous years, a substantial proportion of students identified as special needs were placed into a separate file by the state. To comply with FERPA, the student identifier process was different than the one employed for non-special needs students. Thus, the two files could not be merged together which prohibited the use of the data in years prior to 2008.
With respect to the different types of TAKS tests, the TAKS-modified (TAKS-M) and TAKS-alternate (TAKS-A) tests were developed for students that require some alternate test form based on either modifications or an alternative assessment strategy to meet the needs of the student under either Section 504 of the Rehabilitation Act of 1973 or under an Individual Education Plan. Unfortunately, relying on test type does not directly assess the number of students in special education. Some special education students do not require any special test modifications while other students (such as those with a 504 plan) may require modifications but not be designated as special education. Thus, the students taking either a TAKS-A or TAKS-M test were not designated as special education, but rather as having special needs with respect to state standardized assessments. This is an important distinction because many 504 and special education students need only minimal changes in instruction and additional assistance while those requiring special testing are far more likely to require extra attention and assistance by educators.
TEA described the TAKS-modified test in the following manner:
The Texas Assessment of Knowledge and Skills–Modified (TAKS–M) is an alternate assessment based on modified academic achievement standards designed for students who meet participation requirements and who are receiving special education services. TAKS–M has been designed to meet federal requirements mandated under the No Child Left Behind (NCLB) Act. According to federal regulations, all students, including those receiving special education services, will be assessed on grade-level curriculum. TAKS–M covers the same grade-level content as TAKS, but TAKS–M tests have been changed in format (e.g., larger font, fewer items per page) and test design (e.g., fewer answer choices, simpler vocabulary and sentence structure).
(Retrieved from http://www.tea.state.tx.us/student.assessment/special-ed/taksm/
TEA described the TAKS-alternate test in the following manner:
TAKS–Alternate (TAKS–Alt)is an alternate assessment based on alternate academic achievement standards and is designed for students with significant cognitive disabilities receiving special education services who meet the participation requirements for TAKS–Alt.* This assessment is not a traditional paper or multiple-choice test. Instead, it involves teachers observing students as they complete state-developed assessment tasks that link to the grade-level TEKS. Teachers then evaluate student performance based on the dimensions of the TAKS–Alt rubric and submit results through an online instrument. This assessment can be administered using any language or other communication method routinely used with the student.
(Retrieved from http://www.tea.state.tx.us/student.assessment/taks/accommodations/)
While other measures of special needs or special education designation would certainly be important as well, such measures were not available in the data procured from the Texas Education Agency. The measures included in the analyses were selected for two reasons: First, because the data can be used to directly address claims of charter school proponents; and, second, research suggests each measure is associated in some manner with school-level test score levels as well as school-level growth.
Understanding Z-Scores
Transforming the TAKS scale scores into z-scores not only controls for differences in scores across time (scale scores typically increase for the same grade level in each successive year), z scores have some important properties that allow for arguably better and easier to understand comparisons of average scores between schools.
First, transforming scale scores into z scores creates a set of scores that are normally distributed as in the well-known bell-shaped curve. Second, placing the scale scores into z-scores creates some useful properties that make comparisons across schools easier. For example, a z-score distribution creates a mean of zero. Thus, the average student in a cohort of students has a z-score of zero. Thus, once the scale scores are converted into z scores, the z scores indicate how far a student’s score is from the statewide average. If a student had a positive z-score, then the student’s score was above average. If a student had a z-score that was negative, then the student’s score was below average. Not only does the z-score indicate direction, but also magnitude. So, for example, if a student had a z-score of 1.0, then that student had a score that was 1.0 standard deviations greater than the score for the average student. If a student had a z-score of -0.45, then that student had a score that was 0.45 standard deviations lower than the score for the average student.
Third, we know that a certain percentage of students fall within each standard deviation. For example, we know that 34.1% of students will have a TAKS z-score between 0.0 and +1.0 and 34.1% of students will have a TAKS z-score between 0.0 and -1.0. Because of this characteristic of normal curves, we can translate the z-scores into percentile rankings. For example, if a student has a TAKS z-score of +2.0, then we know that only about 2% of students have a greater TAKS z-score and 98% of students have a lower TAKS z-score. If a student has a TAKS z-score of -1.0, then we know that about 85% of students have a greater TAKS z-score and about 15% of students have a lower TAKS z-score.
One difficulty in examining charter school students is determining the appropriate comparison group of students. Often, state education agencies, charter school representatives, and media personnel compare charter schools and students to all other schools and students. While such a comparison provides some useful information, such comparisons are flawed because charter schools are located in distinct locations. As such, enrollment in a charter school is typically limited to those students that live relatively close to the charter school. So, for example, a student living in Texarkana cannot enroll in a charter school in Houston. Thus, most researchers employ a different comparison group of schools and students rather than simply all schools or students.
Thus, this study examines four different comparisons: all Texas students, same geographic location, same zip code, and sending schools. Each of the four comparisons is described in more detail below.
1) All Texas Students
One comparison made in this report was charter schools and charter students compared to all schools and all students in Texas. Thus, for example, the incoming characteristics of students entering a charter school in the 6th grade would be compared to the characteristics of all 5th grade students in all Texas schools.
2) Same Geographic Location
The second comparison employed in this analysis was between a selected charter school and all schools in the same geographic location. The same geographic location was defined as all schools located in the zip code in which the charter school was located or in a zip code contiguous to the zip code in which the charter school was located.
3) Same Zip Code
The third comparison employed in this analysis was between a selected charter school and all schools in the same zip code. Thus, a charter school and the students within the charter school were compared to only schools and students within schools located in the same zip code as the charter school.
4) Sending School
The final comparison employed in the analysis was between a selected charter school and the students in that charter school to schools and the students within the schools that sentat least one student to the selected charter school over the given time period. This comparison was used by both Mathematica (2010)in their analyses of charter schools. Such a comparison seems most appropriate when comparing characteristics of students, characteristics of schools, or student performance.
Selected Charter Schools
This study focused on nine charter schools that served students in grades four through eight. Most were charter management organizations (CMOs) that included multiple schools and had schools across the different grade levels such that the CMOs served students from kindergarten through the 12th grade. These charter schools are referred to as charter management organizations (CMOs) in this paper even though, in some cases, only one school from a CMO was included in an analysis.
Table 2 lists, in descending order, the CMOs with the greatest number of incoming 6th grade students from Texas public schools and other schools not in the Texas public school system for the years 2005 through 2011. The number of incoming students excluded students already enrolled in that particular CMO in the previous grade. Thus, for example, a student enrolled in KIPP in the 5th grade and then the 6th grade was not identified as an incoming student for KIPP in the 6th grade.
Ultimately, nine of the 15 CMOs with the largest number of incoming 6th grade students were included in this study. These CMOs appear in bold in the table below. CMOs that utilized on-line or distance education were excluded from the study as were CMOs that focused on students at-risk of dropping out of school. Overall, these nine CMOs enrolled almost 60% of all of the incoming 6th grade students into Texas charter schools.
The two largest CMOs—Harmony and Yes Prep—both accounted for 15% of all students entering charter schools in the 6th grade. Two schools—Responsive Education and Southwest Virtual School—were not included in subsequent analyses because creating a set of comparison schools based on zip codes simply did not apply to a virtual school. Houston Gateway could conceivably have been selected for inclusion, but Inspired Vision had a greater percentage of incoming students with data from the 5th grade than the Gateway charter. The Radiance Academy could have been chosen, but it was unclear as to whether the Radiance charter was associated with other charters with the same or similar names. Thus, rather than risk making a mistake in correctly identifying the complete set of schools for the CMO, I selected the next school on the list which was Inspired Vision.
Derrick Brown
August 25, 2012
This is significant work, Dr. Fuller, and I am glad to have come across it this morning.
I would like to conduct a similar study here in Georgia. Perhaps we can collaborate.
debryc
August 26, 2012
Hello, I have information that could help you redo the analysis of the KIPP schools.
KIPP does not have a single middle school that begins with the sixth grade as a starting year. They all start at the fifth grade. Instead, to get the fifth grade data on KIPP middle schools that seem to start in the sixth grade, you need to search for a data that appears to be coming from a KIPP elementary feeder school.
As an example, KIPP Academy in Houston’s TAKS scores are reported 6-8, but that is because KIPP Academy’s 5 grade is under a different charter. I think this is a documentation quirk that results from middle schools traditionally starting in the 6th grade in Texas.
A further complication is that it wouldn’t make sense to use the KIPP Academy data starting in 2010 or KIPP Sharpstown data starting 2012 because they now both enroll students who have gone to KIPP elementary schools. The TAKS scores of incoming students will now reflect what KIPP elementary schools have done.
Hope this helps.
debryc
August 26, 2012
I’d like to see how the difference in TAKS scores between incoming fifth grade KIPP students and neighborhood schools’ incoming fifth graders change when you include data from ALL the KIPP middle schools.
KIPP also should not be part of the analysis for incoming sixth graders because there are no KIPP schools that start in the sixth grade.
For future research, I wonder if there’s a way to measure if there is a statistical difference in students entering Texas charter schools based on student behavior. For example, if an elementary school sends ten students to KIPP, are they reflective of their elementsry’s school’s population in terms of behavior… Number of days absent, number of referrals, etc. I imagine this would be difficult to do.
Dr. Ed Fuller
August 26, 2012
I included all KIPP schools in the analysis. In examining incoming 5th and 6th grade students, I excluded all students previously enrolled in KIPP. So, if a student was enrolled in KIPP in the 4th grade, then the student was excluded from the analysis for incoming 5th graders. Same with a student enrolled in KIPP in the 5th grade and then enrolled in a new KIPP school in the 6th grade. In fact, no matter what, if a student was enrolled in any KIPP school in the previous year, they were excluded from the analysis.