Should Austin ISD enter into a contract with IDEA Charter Schools to address concerns about low performance in East Austin schools? To answer this question, the school board would need have an independent analysis of the efficacy of IDEA in improving the achievement of students, especially low-income, low-performing, Latino students. And this study, while not exhaustive in nature, aims to examine the track record of IDEA.
My rebuttal to the AISD critique of my study (see the Austin American Statesman at (http://www.statesman.com/news/local/austin-school-district-says-critical-idea-study-doesnt-2085799.html?page=2) can be found at:
Additional information on IDEA can be found on this blog can be found by right clicking the links below or or clicking on the title of this blog at the top of the page:
https://fullerlook.wordpress.com/2011/12/18/idea-and-martin-ms-disappearance-rate/
https://fullerlook.wordpress.com/2011/12/17/achievement-gap-in-aisd-and-idea-charter-schools/
https://fullerlook.wordpress.com/2011/12/09/idea-academy-vs-east-austin-schools/
This study was the basis for the Austin American Statesman story at http://www.statesman.com/news/education/study-challenges-idea-charters-success-claims-1971526.html
+++UPDATE 1+++Note that the Austin ISD and IDEA refutations of this study comes in the form of attacks on me and my ability as a researcher. This is a common tactic employed when a study critiques any organization. If the data and analysis are accurate–and they are as you will see below–then the only defense is to attack the messenger and use a slice of data that makes the organization look good.
***UPDATE 2***Some have commented that the difference in the student characteristics between those students entering IDEA Charter schools and local public schools is parental decisions about where to send their children and not attributable to IDEA. While IDEA may not intentionally skim students, we don’t know whether they do or not. IDEA leaders maintain they knock on every door in the region. A principal of a school in the Rio Grande claims that IDEA personnel have come onto public school campuses to recruit specific students. Neither, one of the two, or both could be true. Regardless, it does not matter what the intentions of IDEA are. The fact remains that IDEA systematically enrolls students who are more advantaged than students remaining in the local public schools. This directly CONTRADICTS the claim by IDEA that they educate “underserved” students. In fact, IDEA has STILL NOT communicated how they define “underserved” students.
This study (funded by the Texas American Federation of Teachers was undertaken to examine the claims made by the leaders of IDEA Charter Schools and to determine if IDEA has the requisite experience needed to successfully address the needs of students in East Austin. TAFT NEVER asked me to arrive at specific conclusions. They simply asked me to examine the data and report back. That is the ONLY way I contract with funders. I have never, and will never, engage in a contract in which the outcomes of the study are pre-determined.
To examine the track record of IDEA, I relied on student-level obtained from the Texas Education Agency through the Texas Business and Education Coalition (TBEC). Such data are necessary to determine the characteristics of students entering and leaving IDEA Charter Schools since some claim that charter schools are only successful because entrants are relatively high-performing and lower-performing students are more likely to leave. In combination, these two phenomenon would make charter schools appear more successful than they would otherwise appear. Regular neighborhood schools—such as those in East Austin—must enroll any student who shows up at the school door instead of only those choosing to enroll in the school. Further, neighborhood schools are tasked to keep all students in the school, regardless of performance and effort level.
This report examines three claims by IDEA Charter schools:
- IDEA educates “underserved” student populations;
- All IDEA graduates enroll in post-secondary institutions of education, thus implying low student attrition; and,
- IDEA Charter schools outperform other schools.
My conclusions, for those of you who don’t want to read through the post, are as follows:
1) IDEA Charter schools do not enroll “underserved” students regardless of the measure used to identify “underserved.” Specifically, as compared to schools in the same market, IDEA schools enroll lower percentages of economically disadvantaged students, special education students, bilingual education students, students requiring modifications or accommodations on the Texas Assessment of Knowledge and Skills (TAKS), and students scoring below average on the TAKS mathematics or TAKS readings tests.
2) IDEA Charter schools send 100% of graduates to post-secondary institutions of higher education only if the actual number of graduates is the group of students examined. If we consider the number of students starting in the 9th grade as the cohort of students of interest, then the percentage of IDEA students entering post-secondary institutions of higher education is, at best, around 65% for the cohort of 9th grader students in 2009.
3) One reason why IDEA secondary schools outperform high schools in the same area is because IDEA Charter schools lose a greater proportion of lower performing students than higher performing students. This disproportionate disappearance rate of students would increase overall TAKS scores at the school and district levels even if the remaining students made no increase in achievement
While further study of additional cohorts is needed, this preliminary study strongly suggests that claims of academic superiority and helping the “underserved” students in the Rio Grande Valley are simply false or misleading. More importantly, this study calls into serious question the claim that IDEA Charter schools have the background, experience, and track-record necessary to educate all types of students in East Austin. This study suggests that IDEA Charter schools rely in part on the “creaming/skimming” of students and the student disappearance of lower performing students to achieve their success.
Claim #1: IDEA Educates “Underserved” Student Populations
One claim made by IDEA leaders is that IDEA serves “underserved” populations of students. This is an extremely important contention since it is the basis of IDEA’s claim to superiority to other schools. Essentially, the claim is being made that students are not being well-served in traditional public schools in the areas served by IDEA schools and that IDEA schools can enroll such students and serve such students well.
Unfortunately, IDEA representatives never define what “underserved” actually means. In this analysis, “underserved” is defined in three ways:
- percentage of economically disadvantaged students;
- percentage of special needs students, including English Language Learners students and those requiring accommodations or modifications on the TAKS tests; and,
- percentage of students not passing the TAKS test in reading and math.
To examine whether IDEA schools enroll underserved students, I examined the characteristics of students enrolled in the 5th grade in 2008 for schools that sent at least three students to IDEA schools in the 6th grade in 2009. Since IDEA enrolls some 5th grade students, these students were excluded from the analysis.
Middle Schools
Percentage of Economically Disadvantaged Students
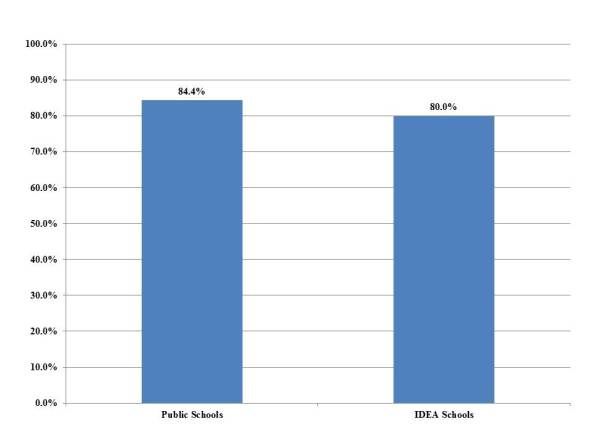
Figure 1 shows the percentage incoming 6th grade students (2009) designated as economically disadvantaged in the 5th grade (2008). While the difference is not large, clearly a greater percentage of the 5th grade students entering 6th grade in public schools were economically disadvantaged than the 5th grade students entering IDEA Charter schools in 6th grade. Specifically, 84.4% of the students enrolling in public schools were economically disadvantaged as compared to 80.0% students enrolling in IDEA schools. Thus, by this measure, IDEA schools enroll fewer “underserved” students than public schools in the same area as IDEA schools.
Figure 1: Percentage of Economically Disadvantaged in 5th Grade Public Schools (2008) Enrolling in the 6th Grade (2009) for Public Schools and IDEA Charter Schools
 Data Source: Student-level TAKS data from 2008 and 2009; Analysis: Ed Fuller
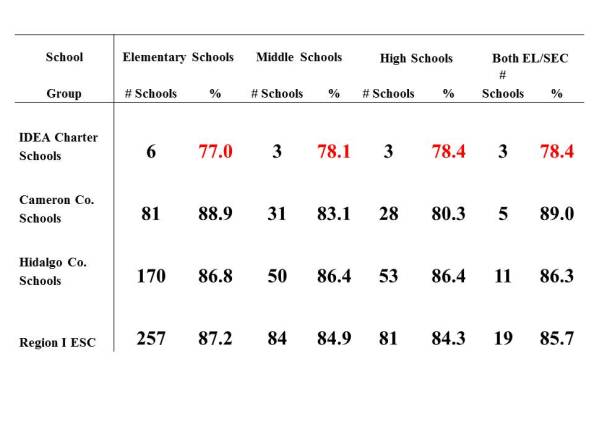
Not surprisingly, then, IDEA Charter schools have a lower overall average percentage of economically disadvantaged students than other schools in either Cameron County, Hidalgo County, or throughout the entire Region I Education Service Center area. Indeed, as shown in Table 1, IDEA schools have a substantially lower percentage of economically disadvantaged students at the elementary school level and a moderately lower percentage at the middle school level. IDEA does not have traditional high schools serving grades 9 through 12, but rather have schools serving grades 6 through 12. Thus, IDEA schools are compared to both high schools and both elementary/secondary schools. Regardless of the comparison group, IDEA secondary schools have slightly lower percentages of economically disadvantaged students.
Table 1: Percentage of Economically Disadvantaged Students in IDEA Charter Schools and other Schools in Cameron County, Hidalgo County, and Region I ESC in 2010 by School Level
Data Source: 2010 Academic Excellence Indicator System (AEIS), TEA website
Analysis: Ed Fuller
Percentage of Special Needs Students
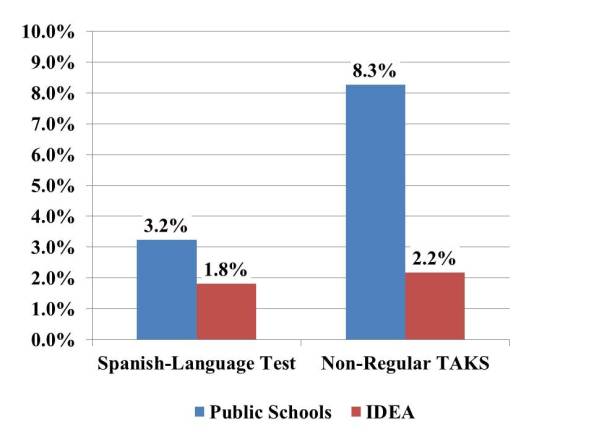
As shown in Figure 2, public schools enrolled a greater percentage of students who took a Spanish-language TAKS test in the 5th grade in 2008 or who took a non-regular TAKS test in the 5th grade in 2008. A non-regular TAKS test includes TAKS tests that provide accommodations or modifications to students or students are exempted for Limited English Proficient (LEP) reasons.
Figure 2: Percentage of Incoming 6th Grade Students that took the Spanish-Language TAKS or a Non-Regular TAKS Test on the 5th Grade Mathematics TAKS (2008)for Public Schools and IDEA Charter Schools (2009)
Data Source: Student-level TAKS data from 2008 and 2009 Analysis: Ed Fuller
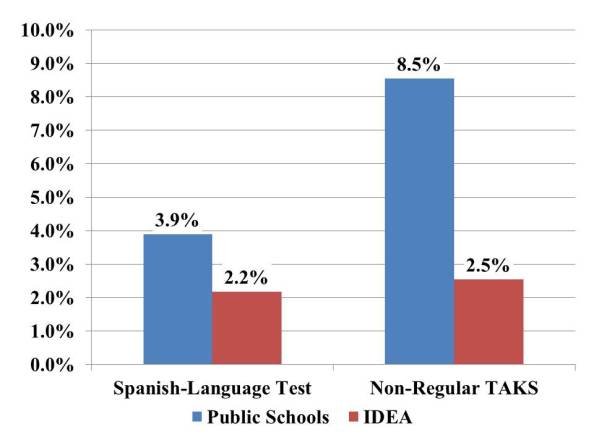
As shown in Figure 3, the results for reading was similar, with greater percentage of students taking the Spanish-language TAKS or a non-regular TAKS test entering public schools than IDEA charter schools.
Figure 3: Percentage of Incoming 6th Grade Students that took the Spanish-Language TAKS or a Non-Regular TAKS Test on the 5th Grade Reading TAKS (2008) for Public Schools and IDEA Charter Schools (2009)
 Data Source: Student-level TAKS data from 2008 and 2009 Analysis: Ed Fuller
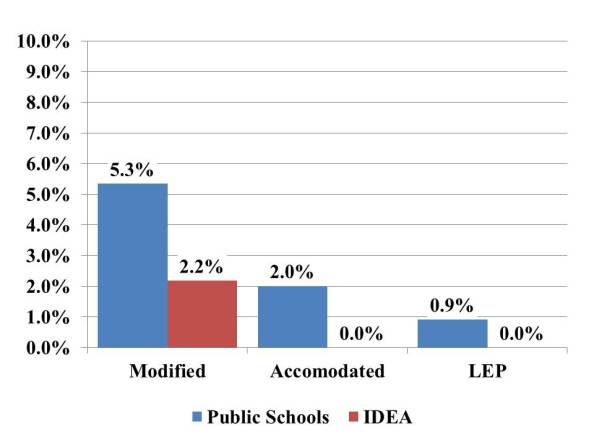
Figure 4 provides more details on the non-regular TAKS tests taken by students in the 5th grade. IDEA schools did not enroll any students that took a TAKS-accommodated 5th grade mathematics TAKS or that were exempted from the TAKS for LEP reasons. The public schools in the IDEA charter market area enrolled more than twice the percentage of students taking a TAKS-modified 5th grade mathematics TAKS test than IDEA charter schools.
Figure 4: Percentage of Incoming 6th Grade Students that Took Non-Regular TAKS Tests
for 5th Grade TAKS Mathematics in 2008 for Public Schools and IDEA Charter Schools by Test Type
 Data Source: Student-level TAKS data from 2008 and 2009 Analysis: Ed Fuller
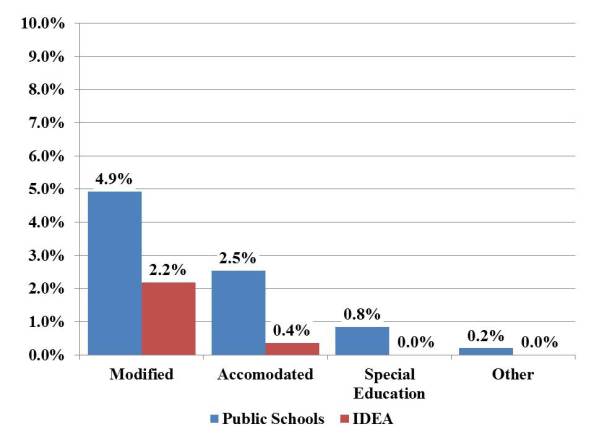
Figure 5 reveals similar results, with a greater percentage of incoming 6th grade students in public schools taking TAKS-modified and TAKS-accommodated tests and a greater percentage being exempted for special education reasons or for other reasons than incoming 6th grade students in IDEA Charter schools.
Figure 5: Percentage of Incoming 6th Grade Students that Took Non-Regular TAKS Tests
for 5th Grade TAKS Reading in 2008 for Public Schools and IDEA Charter Schools by Test Type
 Data Source: Student-level TAKS data from 2008 and 2009 Analysis: Ed Fuller
Thus, in terms of students taking the Spanish-language TAKS test or taking non-regular TAKS tests for the 5th grade TAKS mathematics test in 2008, public schools in the IDEA charter market area enrolled a greater percentage of underserved students than the IDEA Charter schools.
As shown in Table 3, IDEA Charter schools enroll a lower percentage of special education students across all school levels in Cameroon and Hidalgo counties as well as for all schools in Region I. The differences, in fact, are rather substantial. This is extremely important because special education students tend to be more expensive to teach, more difficult to teach, and likely do not function as well in high stress settings.
Table 3: Percentage of Special Education Students in IDEA Charter Schools and other Schools in Cameron County, Hidalgo County, and Region I ESC in 2010 by School Level
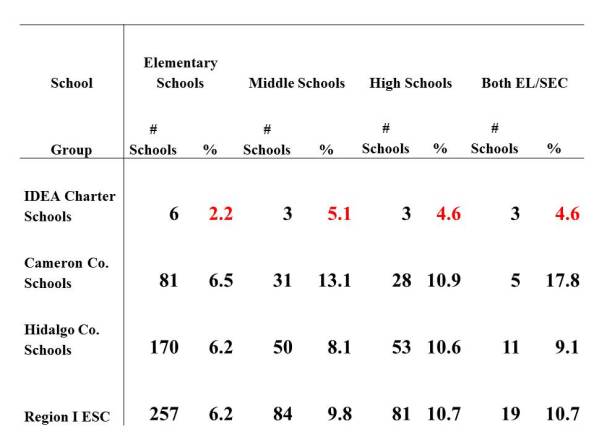 Data Source: 2010 Academic Excellence Indicator System (AEIS), TEA website; Analysis: Ed Fuller
An IDEA spokesperson claims that the lower percentage of special education students is a result of not mis-labeling children as special education. This means that IDEA is charging other schools in the Rio Grande Valley with mis-identifying children as special education. Only those who work in the IDEA Charter schools know the truth. But, as shown in the figures above, there was a lower percentage of incoming 6th grade students identified as special education or bilingual education. The identification of these children in 5th grade was NOT under the control of IDEA, so “better” identification does not explain the difference for incoming students.
In addition, IDEA Charter schools enroll a lower percentage of bilingual students than other schools in Cameroon and Hidalgo counties and all schools in Region I.
Table 4: Percentage of Bilingual Education Students in IDEA Charter Schools and other Schools in Cameron County, Hidalgo County, and Region I ESC in 2010 by School Level
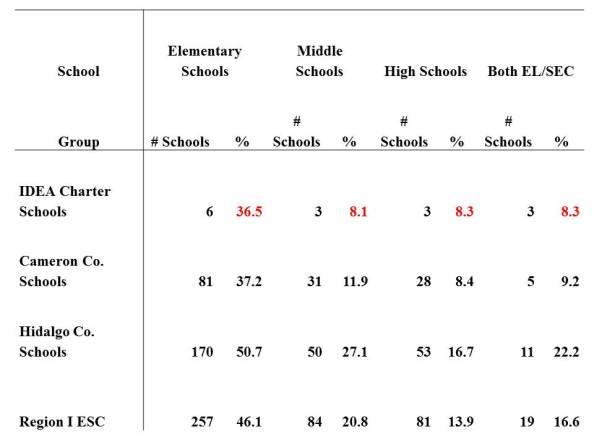 Data Source: 2010 Academic Excellence Indicator System (AEIS), TEA website; Analysis: Ed Fuller
Percentage of Students Not Passing TAKS
Students not passing the TAKS test are certainly “underserved” students since all students should be able to meet minimum standards on the TAKS test. As shown in Figure 6, public schools in the IDEA charter market area enrolled a greater percentage of students that had not passed the 5th grade TAKS mathematics or TAKS Reading tests in 2008 than IDEA Charter schools. Indeed, the percentage of students not passing in public schools was twice the percentage as for IDEA schools for both mathematics and reading.\
Figure 6: Percentage of Incoming 6th Grade Students Not Passing the 5th Grade TAKS Mathematics and Reading Tests in 2008 for Public Schools and IDEA Charter Schools
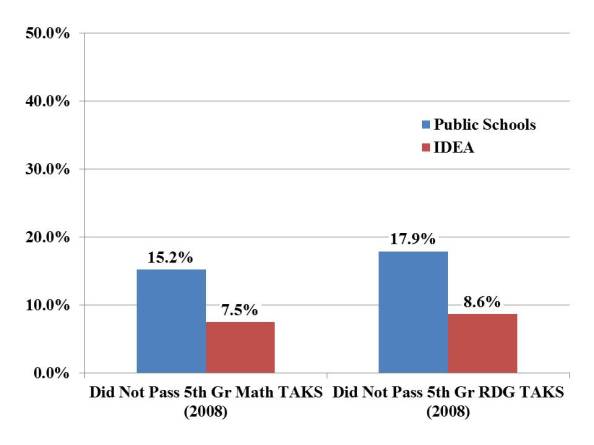 Data Source: Student-level TAKS data from 2008 and 2009; Analysis: Ed Fuller
Tables 5 and 6 provide a more detailed and recent look at the academic achievement of students entering IDEA Charter schools in the 6th grade in 2011 from public schools in the 5th grade in 2010. The comparison set of schools to the IDEA Charter schools is a set of schools in Region I ESC that sent 3 or more students to an IDEA charter school. These schools enrolled over 4,600 students. Almost 300 of the 5th grade students entered IDEA Charter schools.
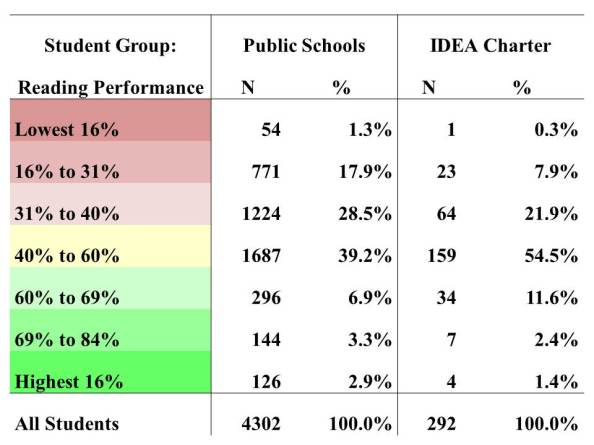
Table 5 shows that a greater percentage of lower-performing students entered the public schools and a greater percentage of higher performing students entered IDEA Charter schools. Table 6 shows that a greater percentage of lower-performing students entered public schools and a greater percentage of average and higher-performing students entered IDEA Charter schools.
Table 5: Prior Student TAKS Mathematics Performance for 5th Grade Public School
Students (2010) Entering IDEA Charter and Public Schools in the 6th Grade (2011)
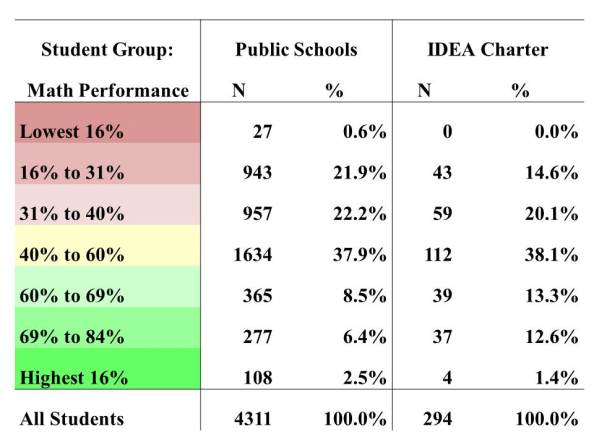 Data Source: Student-level TAKS data from 2010 and 2011; Analysis: Ed Fuller
Table 6: Prior Student TAKS Reading Performance for 5th Grade Public School
Students (2010) Entering IDEA Charter and Public Schools in the 6th Grade (2011)
Data Source: Student-level TAKS data from 2010 and 2011; Analysis: Ed Fuller
So, even when “underserved” is measured by prior student performance, IDEA Charter schools enroll a lower percentage of “underserved” students than public schools. Further, only 34% of students entering IDEA Charter schools had lower than average mathematics scores and 30% had lower than average reading scores. The percentages for public schools were 44% and 48%.
Student Characteristics Predicting Entrance into IDEA Charter Schools from 5th to 6th grade
To explore these student characteristics further, I employed logistic regression analysis to examine the association between student characteristics of 5th grade students and the likelihood of such students enrolling in an IDEA Charter school. The outcome variable was enrolling in an IDEA Charter school. The student characteristics included in the analysis were economically disadvantaged status, passing the TAKS test, taking the regular TAKS test, whether the student had a valid TAKS score, and whether the student took the English-language TAKS test in 5th grade. The pool of students included in the analysis included all 5th grade students enrolled in schools in which sent at least three students to an IDEA Charter school in the 6th grade in 2009.
Economically disadvantaged students and students with valid TAKS scores were no more or less likely to enroll in IDEA Charter schools. However, in a more recent analysis focusing on 5th grade students in 2010 entering the 6th grade in 2011, economically disadvantaged students were 30% less likely to enroll in an IDEA Charter school. In mathematics, students taking the English-language TAKS were no more or less likely to enroll in an IDEA Charter school, while students taking the English-language TAKS test in reading were 2.65 times more likely than students taking the Spanish-language TAKS to enroll in an IDEA charter school. However, the finding was statistically significant only at the p < .10 level rather than the standard p < .05 level.
Students passing the TAKS mathematics test were almost two times more likely to enroll in an IDEA Charter school than students who did not pass.
Students passing the TAKS reading test were twice as likely as students not passing the TAKS reading test to enroll in an IDEA Charter school.
The same findings for passing TAKS mathematics and TAKS reading in the 5th grade were also found in a subsequent analysis of 2010 5th grade students entering 6th grade in 2011.
Finally, students taking the regular TAKS test were in mathematics were 3.3 times more likely to enroll in an IDEA Charter school than students not taking the regular TAKS test while students taking the regular reading TAKS were four times more likely to enroll in an IDEA Charter school than students not taking a regular TAKS test.
Thus, even when controlling for other variables, “underserved” students were less likely to enroll in IDEA Charter schools and more likely to enroll in public schools—even when examining only students in schools that send students to IDEA Charter schools.
Middle School Conclusion
For this one particular cohort of students, IDEA schools most certainly did not enroll a greater percentage of “underserved” students than public schools in the same market as IDEA Charter schools. In fact, public schools enrolled a greater percentage of “underserved” students than IDEA Charter schools for all three measures of underserved. In short, then, the data suggests that IDEA Charter schools may, in fact, be “skimming” or “creaming” the better prepared and least difficult students to teach.
Claim #2: All IDEA graduates enroll in college
Claims Made by IDEA
Another claim made by IDEA leaders is that 100% of IDEA graduates enroll in higher education. Technically, this statement is rue. However, a more accurate picture of the success of a high school in preparing students for life after high school is the percentage of students from a 9th grade cohort who graduate and enroll in higher education.
Unfortunately, such data is confidential and must be accessed through the state-sponsored Education research Centers. However, publicly available student-level data such as the data used in this report can shine some light in this area. Specifically, the TAKS data can be used to examine the percentage of students from a 9th grade cohort still enrolled in the same school after two years and enrolled in the 11th grade in the same school after two years.
Analysis and Findings
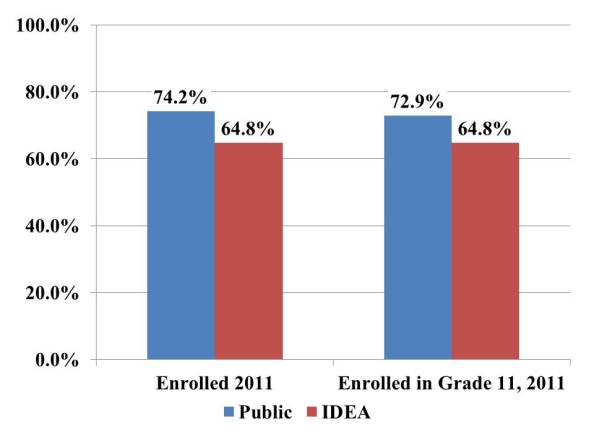
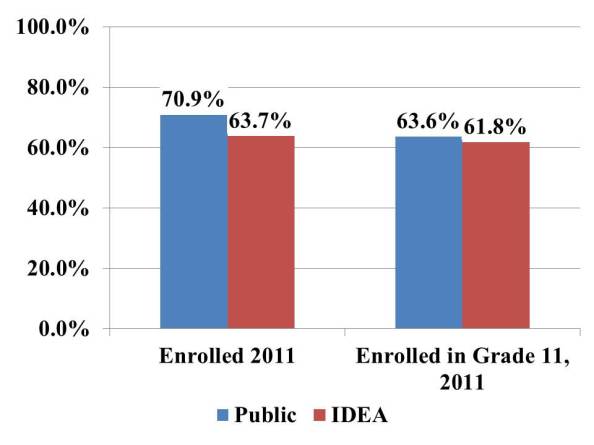
As shown in Figure 7, a moderately greater percentage of 9th grade students from public schools within the IDEA Charter market remained enrolled in the same school in 2011. Neither group of schools had a particularly high level of retention of students in the same school, but at least public schools held on to at least 70% of 9th grade students. IDEA Charter schools could only keep about 64% of students at the school. Worse yet, only slightly greater than 60% of 9th grade students advanced one grade level per year and were enrolled in the 11th grade in 2011.
Figure 7: Percentage of 9th Grade Students (2009) Remaining in the Same School and Enrolled in the 11th Grade in the Same School in 2011 for Public Schools and IDEA Charter Schools (All 9th Grade Students included)
Data Source: Student-level TAKS data from 2008 and 2009; Analysis: Ed Fuller
When the analysis is restricted to only first-time 9th grade students (students were enrolled in the 8th grade in 2008), the discrepancy between public schools in the IDEA Charter market and IDEA Charter schools grows wider. Indeed, for simply retaining students in the same school, the percentage for public schools was 10 percentage points greater than for IDEA schools. In addition, the difference for advancement to the 11th grade on-time increased from a few percentage points to about 8 percentage points.
Figure 8: Percentage of 9th Grade Students (2009) Remaining in the Same School and Enrolled in the 11th Grade in the Same School in 2011 for Public Schools and IDEA Charter Schools (Only first time 9th Grade Students included)
 Data Source: Student-level TAKS data from 2008 and 2009; Analysis: Ed Fuller
Regression Analysis
To further assess the potential differences between public schools in the IDEA market and IDEA Charter schools, I employed logistic regression analysis. The outcome variable was staying enrolled in the same school from the 9th grade in 2009 to any grade level in 2011. Only first-time 9th grade students were included in the analysis and only students enrolled in an IDEA Charter school or in a public school within the IDEA market were included in the analysis.
A number of control variables at the student- and school-level were included in the analysis. These variables included student economically disadvantaged status, 9th grade TAKS math scale score in 2009, TAKS reading scale score from 2009, the percentage of poor students in the school, the percentage of Hispanic students in the school, the percentage of special education students in the school, and total school enrollment. Finally, a binary variable that indicated whether or not a student was enrolled in an IDEA Charter school was included in the equation.
Not surprisingly, student achievement had powerful and positive effects on the odds that a student would remain enrolled in the same school. Poverty, both at the individual and school-levels, were negatively associated with staying in the same school. School size was also positively associated with staying at the same school.
Finally, after controlling for the aforementioned factors, students enrolled in IDEA Charter schools were about 64% less likely to remain enrolled in the same school than their peers in public schools within the IDEA Charter market. This finding was statistically significant at the p < .001 level.
Conclusion
While 100% of IDEA graduates enroll in higher education, the sad truth of the matter is that, at best, only 65% of the original 9th grade cohort in IDEA Charter schools makes it to the 11th grade while still enrolled in an IDEA school. Further, even after controlling for student and school characteristics, 9th grade students were significantly less likely to remain in the same school than students in public schools in the IDEA Charter market.
Claim #3: IDEA Schools Have Greater Achievement than Other Schools
While publicly available data strongly suggests that IDEA public schools perform better than comparison schools in the local labor market, there may be many reasons for the greater performance. One reason not easily discerned by the public or policymakers is peer effects. There is a large and powerful body of evidence that peer effects have a strong and significant impact on student achievement. So, for example, if a student enters a school with a high proportion of motivated, high-performing students, then that student will likely have greater academic improvement than if the student enrolled in a school with an average proportion of highly motivated, high-performing students. These peer effects may be on reason explaining the greater performance of charter schools.
There are several strategies to ensure positive peer effects, some of which have to do with positive behaviors of the school such as holding high expectations and having a strong academic press. Less positive behaviors that can also create a positive peer effect is “skimming” or “creaming” the best students from other schools and pushing out or losing lower-performing students.
As we saw above, IDEA Charter schools appear to be skimming/creaming students at the front-end of enrollment in IDEA Charter schools. Because IDEA schools are typically configured to enroll students in grades 6 through 12, it is far more difficult to examine any skimming/creaming at the 9th grade level.
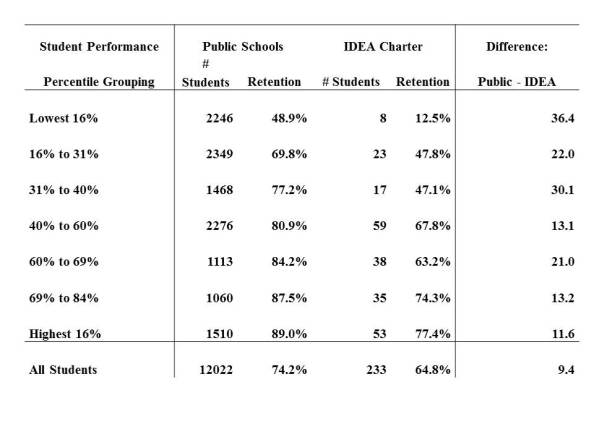
However, we can examine whether IDEA Charters push out or lose students in such a way as to increase the proportion of higher performing students and enhance peer effects. As shown in Table 7, IDEA Charter schools had significantly lower percentages of students remaining in the same school for all student performance levels, but the percentages were strikingly low for the lowest performing students (those in the first three rows). Indeed, for the lowest performing students—those in the lowest 16% of all students in the state, only 12.5% of the eight first-time 9th grade students in an IDEA Charter school remained in the same school over the three-year time span. While this is a small number of students, the fact that only one of eight students remained does not instill great confidence in the ability of IDEA Charter schools to retain low performing students in their schools. Importantly, 32% of the 9th grade students enrolled in Eastside Memorial in 2009 was in this group of lowest-performing students. If IDEA Charter schools cannot keep 8 students enrolled, how will they keep a much greater number of students in the lowest performing group in Eastside Memorial and other schools in Austin ISD.
Table 7: Percentage of First-Time 9th Grade Students (2009)
Remaining in the Same School through 2011 by 9th Grade TAKS Mathematics Performance
 Data Source: Student-level TAKS data from 2008 and 2009;Analysis: Ed Fuller
In addition, it is important to note the school retention rates within IDEA schools. Clearly, higher performing students are much more likely to remain at the same school than lower performing students. This systematically improves the overall TAKS scores of IDEA Charter schools without any additional achievement gains by the remaining students.
Further, I also employed logistic regression analysis for students scoring in the 40% to 60% percentile range or lower (in other words, average performing or below-average performing students). After controlling for student and school factors such as economically disadvantaged status and prior test scores, students scoring below average in IDEA schools (n = 48) were 85% less likely to remain at the same school than their peers in public schools in the IDEA Charter market. To reiterate—9th grade students in IDEA Charter schools scoring average or below-average were 85% less likely to remain at the same school than their peers in public schools in the same neighborhoods.
Thus, IDEA Charter schools push out/lose a greater percentage of lower performing students. In doing so, they accomplish two outcomes. First, they increase the overall TAKS scores since they lose a greater percentage of lower- than higher-performing students. Second, they enhance the overall positive peer effect the student composition exerts on other students. In fact, it may be this very pressure that leads to lower-performing students leaving the school.
Final Conclusions
Austin ISD should be incredibly wary of entering into a contract with IDEA Charter schools to manage campuses and instruct students in East Austin. As this short study has shown, serious questions need to be asked about the veracity of the claims of IDEA executives and the ability of IDEA schools to educate lower-performing students. Indeed, this study shows that, at least for one cohort of middle school students and one cohort of high school students, IDEA schools do not enroll “underserved” students, do not even remotely approach graduating 100% of the 9th grade cohort, and push out/lose substantial percentages of lower performing students. In fact, IDEA appears to have less ability to engage lower-performing, underserved students than the public schools within the same IDEA Charter market within which IDEA draws its students.
Of course, having IDEA Charters into the Austin market may also damage Austin ISD schools. If the trends in the current IDEA Charter market hold true in Austin, IDEA Charter Schools will cream/skim the higher-performing students from East Austin schools and send back the lower performing students to Austin ISD schools as the students progress through high school. This could result in a systematic sorting of students in which IDEA (and other) charter schools enroll more motivated, better supported, and higher-performing students and leave the less motivated, less supported, and lower performing schools segregated in the East Austin public schools. This will only make recruiting and retaining effective teachers and school leaders even more difficult than it already is in East Austin.
Jim
November 16, 2011
I think it would be useful to also compare IDEA’s averages in the “underserved” categories and in terms of incoming TAKS students against the average for the state of Texas. Your argument that IDEA is not serving underserved populations rests entirely on comparing them to the surrounding public schools, assuming away the issue of most of the RGV being underserved in comparison to the state of Texas.
Dr. Ed Fuller
November 16, 2011
IDEA does not serve the entire state. The relevant comparison group is schools served by IDEA. In fact, the study looked at schools that actually sent at least 3 kids to an IDEA school, so we are looking at schools in the “feeder pattern” for IDEA. When any researcher looks at charters such as IDEA and compares the characteristics of kids to those in the local market (schools in the same neighborhood), then charters almost always enroll a more advantaged group of students. Charter advocates propagate the myth that the serve underserved youth, but that argument falls apart under close inspection.
Jim
November 16, 2011
There’s basically no way IDEA or any charter school can find out if it has a better model unless it is an in-district charter school accepting only neighborhood students then. Because parents/students always self-select. So this can actually be seen as an argument for why Austin bringing in IDEA would be a good idea — to test how effective IDEA really is.
An informative comparison you could make if you limit the comparison to just the RGV is between IDEA and the magnet South Texas ISD schools. I feel this is an apples to apples comparison and a fairer comparison than just saying “IDEA has slightly better students than neighboring schools, therefore any results at IDEA don’t matter.”
Marshall
November 16, 2011
Hi Ed-
Interesting analysis.
Jim’s last comment is spot on. The only conclusion one can draw from most of your analysis is this (assuming we take IDEA at its word that they do not cream-skim, and I do, without evidence to the contrary): fewer economically disadvantaged parents, with underperforming children that may have special needs elect to enroll their children in IDEA than in “local” public schools. That cannot be refuted by what you’ve done, which is problematic since this is the main rival hypothesis that isn’t addressed here. Thus, your evidence in support of cream-skimming is equally as persuasive as evidence of parent self-selection, something for which IDEA can’t be begrudged. These seem to be at empirical loggerheads (Put fancier, in your logistic regression, your omitted variable is “parental something”, which is correlated with your regressors and outcome, which in this case biases your estimates).
That being said: if AISD institutes an in-district charter, and if participation is mandatory for students in this zone, this is exactly the type of exogenous policy change that make people like us salivate. Hopefully, they’re forward-thinking enough to consider sinking money into an evaluation of this type of arrangement. This goes for IDEA, too. These types of opportunities are rare.
Dr. Ed Fuller
November 18, 2011
I compare to local schools because that is the comparison used by IDEA. You never read about them claiming they outperform the local magnet schools or early college schools (partly because they don;t even though, in some cases, the student characteristics are much ore similar.
IDEA will still use a lottery in East Austin. If they would step up and simply take over the lowest performing schools in Austin and educate all kids in the boundary area, I would not be so opposed. But they know that they cannot effectively educate all kids. They have seen KIPP fail repeatedly at this. Much of the success is due to the parental selection–which results on skimming whether IDEA intends to skim o not.
Also, a few university professors from the valley convey the following:
IDEA came on public school campuses to recruit students;
Teachers generally teach to the test, thus raising scores.
I begrudge IDEA not for parental decisions, but acting as if they are superior to all public schools when clearly they are not. Let any public school operate under the same game rules as IDEA, and they will do well also.
Who gets lost in the IDEA game plan and your suggestions of comparison and letting them off the hook for skimming? Poor kids who don’t have involved parents. No one seems to give a crap about them in this whole discussion.
So, as IDEA and other charters expand, the MOST DISADVANTAGED students get left behind. IDEA and others don;t even enroll them, and public schools do not educate them well. However, there are a fair number of neighborhood elementary schools that do very, very well in educating students. In fact, there are several poor, minority schools in East Austin that actually outperform IDEA schools (something not noted by either IDEA nor AISD).
Laura
November 18, 2011
I agree with your comments above- it is the students without involved parents get left behind. I believe that it is a mistake to think a charter or anyone can solve complex, systemic problems and issues in some of the low performing schools. I think your points about kids who don’t make it ending up back in other AISD schools are also very important.
I do agree with Marshall and Jim though- you need to include that parent ‘something’ component as a variable.
Throwing one more thing in here- there are other organizations IN AUSTIN that can address the needs they are seeking to meet by reaching out to IDEA. This is the most puzzling part of it to me.